Use Netlify Functions and the GitHub REST API to add Data Visualization to your Gatsby blog
After a recent Twitter conversation with my good chum Scott we decided we’d run a little experiment that will attempt to broadly achieve the same thing but in two different ways.
This is good mate. I haven’t tried GitHub GraphQL yet.
— 🏴 Paul (@PaulieScanlon) January 3, 2021
I’m assuming it can do all the same things as GitHub REST right? https://t.co/Kjb9PWKKkr
The “end goal” if you like, will be to request data using a GitHub API, or more specifically request data regarding the programming languages used in all repositories for a given GitHub user and render a nice looking Doughnut Chart in a Gatsby Blog.
Like any good scientific experiment we’ve broken it down into five keys areas:
1. Observations
As the above Tweet mentions we’re aware there are two main GitHub API’s available
2. Question
Again, as the above Tweet mentions we’re not quite sure if both API’s can deliver the same data, and we’re unsure if data should be requested at run time or build time and lastly what kind of “graphic method” should be used to surface the data in a data visualization
3. Hypothesis
It’s assumed that a GraphQL API will likely be more flexible in terms of what kind of data can be requested
Whereas the REST API data will be somewhat restricted by the predetermined responses from predefined end points
“fetching” this data via either API method could either be requested at build time and baked into a Gatsby page or requested at run time using a more traditional GET request.
If the request happens at run time a Serverless Function could be used as a middle ground between the blog making the request and the GitHub API end point, but naturally would fail if JavaScript had been disabled in the browser. However requesting data as and when a user visits the page means it will always be in sync with the source data.
If the request happens at build time using Gatsby’s sourceNodes then data would be part of the statically created pages and wouldn’t be affected if JavaScript had been disabled in the browser. However, since the data is only requested at build time there’s a chance it could quickly get out of sync with the source data.
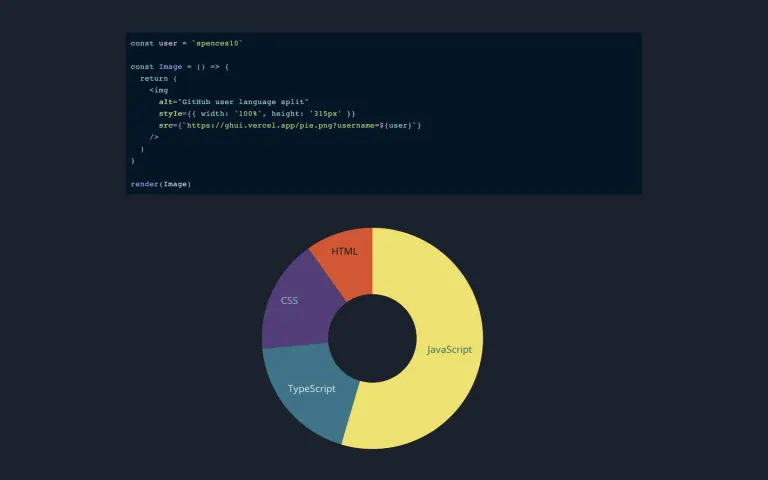
…and as a wild card run time approach Scott suggested using a similar Serverless Function that returns an img src
eg. <img src='https://some-serverless-function/some-source.jpg' /> which would work-round the possible JavaScript
disabled in the browser issue but would require the Chart to be rendered server side.
Displaying data as an image naturally removes any possibility for interactivity or animation and potentially raises some accessibility concerns.
4. Method
To test our Hypothesis we created an Umbrella Issue outlining the experiment in broad terms and below is the tech we’ve chosen to use 👇
Scott
- Gatsby
- TypeScript
- Vercel Functions
- GitHub GraphQL API
- Puppeteer
- Google Charts
Paul
- Gatsby
- TypeScript
- Netlify Functions
- GitHub REST API
- SVG Chart
5. Results
Scott
Scott’s results, demo and repo are available on below links👇
Paul
My demo and repo are available on the below links and my results are explained further down the page 👇
On initial inspection there seems to be no real difference between Vercel Functions and Netlify Functions and we’ve concluded that depending on whoever you use for hosting will most likely determine your choice.
API’s
The API’s on the other hand do differ somewhat. Since this was Scott’s idea it’s largely based around the idea of retrieving all programming languages used for a given GitHuber user.
Using the GraphQL API you can achieve this by requesting languages from the user endpoint. In the query below Scott
has also requested the “top or first 5” results
For brevity i’ve removed some of Scott’s query but you can see the full query here
// GitHub GraphQL - Request

 user(login: $username) {
    repositories() {
      nodes {
        name
        languages(first: 5) {
          nodes {
            color
            name
          }
        }
      }
    }
 }
This query will result in data similar to the below
// GitHub GraphQL - Response

[
  {
    name: 'Some Repo Name A',
    languages: {
      nodes: [
        {
          color: '#e34c26',
          name: 'HTML',
        },
        {
          color: '#563d7c',
          name: 'CSS',
        },
        {
          color: '#f1e05a',
          name: 'JavaScript',
        },
      ],
    },
  },
  {
    name: 'Some Repo Name B',
    languages: {
      nodes: [
        {
          color: '#e34c26',
          name: 'HTML',
        },
        {
          color: '#c6538c',
          name: 'Scss',
        },
        {
          color: '#4F5D95',
          name: 'PHP',
        },
      ],
    },
  },
];
By contrast using the REST API you can nearly achieve the same thing with the following request.
Again for brevity i’ve removed parts of the query but the full query can be seen here
// GitHub REST - Request

.request('GET /users/{username}/repos', {
    username: USER_NAME,
    type: 'owner'
})
This query will result in data similar to the below
// GitHub REST - Response

[
  {
    name: 'Some Repo Name A',
    languages: 'JavaScript',
  },
  {
    name: 'Some Repo Name B',
    languages: 'PHP',
  },
];
Straight away you should be able to see from the response that languages is a single string. Compare this to the
GraphQL response where languages is an array
The REST response appears to only return the predominant language whereas the GraphQL response returns all languages used per repo along with a color value which could be used as an indicator in a graph or legend.
So that’s 1 - 0 to GraphQL. I did attempt to make a second request using the repository
List repository languages
endpoint for each repository returned by /users/{username}/repos but instantly hit the rate limit so unfortunately
deeper information about languages for users doesn’t appear to be possible using the REST API.
Charts
Scott’s approach is for the Chart to be created Server Side and returned as an image url via the Serverless Function. You can see more of that here
This is a really nice solution and will work when JavaScript is either enabled or disabled in the browser as the
endpoint is being used directly as the img src
For example:
<img alt='some chart' src='https://github-user-information-k6t91d33k.vercel.app/card.jpg?username=spences10' />
Some drawbacks I suppose are that the image can only describe itself via an alt tag which perhaps might not be great
for accessibility and naturally images can’t be interactive or animated.
My approach is to use both the sourceNodes API from gatsby-node at build time making the data available in Gatsby’s
GraphQL layer and a ServerLess Function at run time via a typical GET request.
The Chart I created which i’ve amusingly named <MrCharty /> can be seen
here and
has broadly been based on
this article by
Mark Caron
In this post I explain how I created the Chart: Create an SVG Doughnut Chart for your Gatsby blog
On that note, my chart isn’t interactive but given it’s an SVG, it could be ☝️
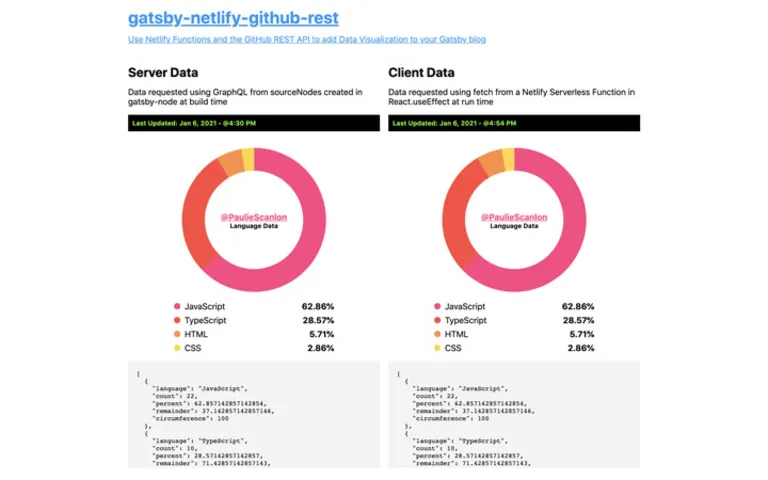
Build Time / Server Data
Using sourceNodes in
gatsby-node i’m using the query to
hit the GitHub REST API and convert the response into GraphQL nodes which are then query-able via Gatsby’s GraphQL
layer… or in simpler terms this data can then be statically baked into the page.
This approach means the Chart will display regardless of if JavaScript is enabled or disabled in the browser. However, since the request to the GitHub REST API happens at build time there’s a high risk this data will become out of sync with the source data. I did investigate the option to use a webhook but as seen above this is only available at a repository level not at a user level.
Run Time / Client Data
Using the same query i’m able to make
a client side request to the
ServerLess Function
which renders the response as a Chart in the “page” component using React’s useEffect and useState.
This approach means data will always be synced with the source data but will only work if JavaSCript is enabled in the browser.
I’ve mentioned “JavaScript is either enabled or disabled in the browser” a few times throughout this post and our reasons for wanting to experiment with alternative approaches isn’t because we’re necessarily concerned that users visiting our blogs will in fact have JavaScript disabled but more because we’re aware that the more client side requests that are made from any given page can and do lead to slower page load times. Both Scott and myself are massive Gatsby fans and always try where possible to keep out load speeds Blazing Fast.
That just about sums up the experiment, and I think the following are the key take away points to consider before attempting to use any of the above approaches as all seem to have prose and cons
- Start with the API, if an API can’t return the data you need, you’ll probably have to modify your idea. In our experiment I believe the GraphQL API is the one you’d want to use.
- If enabled / disabled JavaScript is important consider either an image or generating GraphQL nodes at build time
- Is the source data likely to change a lot? If it does, perhaps a run time request is more favorable than a build time request. However if a webhook is available consider: Gatsby Cloud is your (Good Friend)
- If accessibility and / or interactivity or animation are important an image probably isn’t the best solution.
So there you have it multiple ways to kinda achieve the same thing. JavaScript is hard!
See you around 🕺