Gatsby FuncJam 21
Groovy Analytics, It’s gonna be something to do with Google Analytics
Go Go Go
Aug 18 2021
Here we go again 🕺
In 2019/2020 I blogged every day for 100 days totaling 27,341 words and you can read them all in this post: 100 Days Of Gatsby, but if you don’t have a million hours to spare Gatsby asked me to write a round-up post which can be seen on the Gatsby blog: Challenge Accepted: One Developer, 10 Projects, 100 Days of Gatsby
In 2020 I participated in Gatsby’s Silly Site Challenge and developed my site BumHub in public. You can read all about that in a blog post I updated as the challenge progressed: Silly Site Challenge
…and joy of joys I won!
Here’s the official announcement: Presenting the 2020 Silly Site Challenge Winners!
Gatsby again asked if i’d do a little write up, so here ya go: Bottoms Up: Gatsby File System Route API + Bums = BumHub
And as of about 8pm last night (my time) Gatsby announced #FuncJam
🎊 Announcing: Gatsby #FuncJam!
— Gatsby (@GatsbyJS) August 17, 2021
😎 Now through the end of August, get creative with Functions on Gatsby Cloud for a chance to win exclusive swag and prizes!
👉🏽 Details: https://t.co/5AV8fkRUOJ pic.twitter.com/dgo7EglFEG
… which may or may not be a name I came up with 😏
How about a Func Jam or Fun Jam... a community competition like Theme Jam from 2019 showing all the wonderful ways Gatsby Functions can be used?
— 🏴 Paul (@PaulieScanlon) May 25, 2021
… but either way. I’m doing it, and not for the super duper prizes but because I love it.
As before with Silly Site Challenge I plan to update this blog post as and when I make significant progress.
Update 1
Aug 18 2021
Last night and on my lunch break today I’ve whipped up a new Gatsby site and hosted in on Gatsby Cloud. For now all the site does is display a 3D Globe which I created using React Three Fibre, you can read about how I did that in this post published by Smashing Magazine: Gatsby Serverless Functions And The International Space Station
The idea I have at the moment will be to use both the static and the dynamic offerings from Gatsby.
Static
The Google Analytics API is rate limited and whilst I could hit the endpoint and request all pageViews for the Groovy
Analytics site and plot the lat/lng locations on the 3D Globe using Gatsby Serverless Functions, I fear that the rate
limits will soon cap out and the request would fail. Instead, I’ll be using the power of Gatsby to hit the Google
Analytics API at build time… It’s kinda weird to request data at build time and pump it into a 3D globe because part
of the reason static data is so cool is because it’s baked right into the page, meaning your site is blazing fast, SEO
friendly and works with JavaScript disabled in the browser. Sadly no such luck when using this data to drive
geographical locations on a three.js globe… but, Gatsby if nothing else is totally flexible so why not eh?!
There’s a problem though… This is FuncJam and sourcing data at build time using gatsby-node isn’t making use of
Gatsby Serverless Functions.
Dynamic
To take advantage of Gatsby Serverless Functions I plan to add a number of other features that won’t succumb to rate limiting. These features may include the following:
- Posting reactions to a backend like Fauna
- Adding Authentication using Auth0 to authenticate users
- Allowing authenticated users to leave comments on the site
- Hitting my own abstracted API: paulieapi to display real time Twitter or GitHub information on the site (that API is also built using Gatsby Serverless Functions and hosted on Gatsby Cloud FYI)
- A Newsletter sign up form (gotta have a form in there somewhere right!)
… or maybe all of the above.
I’ll see how much time I have after working my day job building complex / boring React Applications that no one cares about.
Stay tuned for more updates on this post or follow me on Twitter: @PaulieScanlon
Update 2
Aug 19 2021
Last night I added a GitHub action that will rebuild the site every hour: You can see the src here:
https://github.com/PaulieScanlon/gatsby-groovy-analytics/blob/main/.github/workflows/build-me.yml
This takes care of the static data becoming stale and should mean I never cap out the Google Analytics usage quota. The
GitHub actions is scheduled to run every hour and calls the Gatsby Cloud build webhook which in turn rebuilds and
deploys the site.
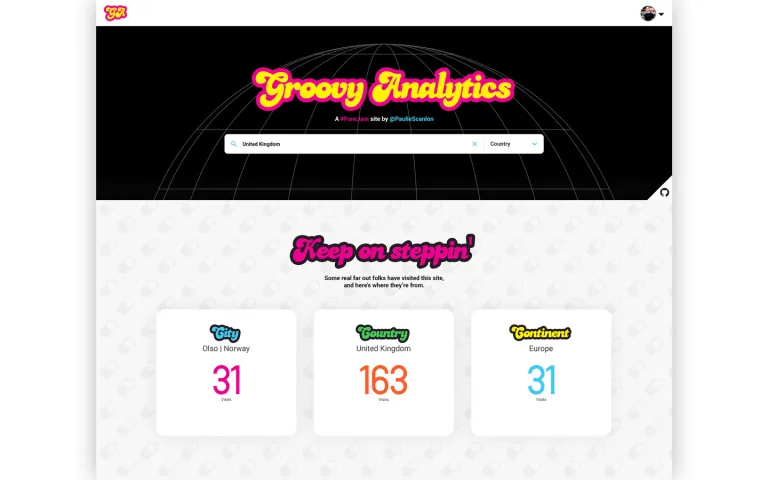
I then tackled the design. This is always my least favorite part of any side project. I’ve got something that i’m pretty happy with. It’s kinda 70s themed and I spent quite a lot of time searching for era correct 70s phrases for the copy.
The design includes sections for statistics and I’ll calculate these using the Google Analytics API, I’ll be crunching
the numbers to surface which city, country, continent, browser, device and operating system have produced the most
pageViews
There’s also a comment form that requires Twitter sign in with Auth0, a reactions section for folks that don’t want to “sign in” or don’t have Twitter but would still like to interact with the site and a Newsletter sign up. The Newsletter sign up will be the same as my my and all submissions go to Queen Raae’s Gatsby newsletter.
I asked last night for folks to visit the site and Gatsby gave me a retweet — lovely stuff
This now means I have enough data to start developing the 3D globe and I think i’m going to add some kind of search functionality so it’s easier to see where on the globe individual locations are, kinda like how you’d filter table data but in the context of the 3D globe.
Here’s a little teaser of where i’m at with the design. I still need to work out what the 3D globe will look like but i’ll trust the process and no doubt continue to tinker in between feature development.
Update 3
Aug 20 2021
Last night over some pints and then today after brunch I added Auth0 to the site. I’m using the Auth0 React package which is absolutely brills. It’s here if you fancy giving it a try: @auth0/auth0-react
I’m using Auth0’s Social Connections so that the only way to sign up/in is to connect via a users Twitter account. This way I don’t need to worry about “confirmation email” or “forgot password” user flows.
If a user is authenticated i’m enabling a comment section, comments are tricky because you might not want anonymous users commenting but I figure if their name is attached to the comment they might think twice before posting profanities or generally being a tinker. — but we shall see.
The comment text, user details and a date are posted to the first of many Gatsby Serverless Functions in this
site. You can see the src for the add-comment function here:
src/api/add-comment.ts
This function is extra secure too because I send an access token collected from Auth0 using the getAccessTokenSilently
hook on the client and verify it using express-jwt on the server before
posting to my Fauna database.
I’ve also prepared for Tonight’s Nattermob stream where I’ll talk Benedicte through how to fetch these comments and display them on a comments page. We’ll also be discussing ways in which Gatsby Serverless Functions can be polled so updates to data can been seen without users needing to refresh the page.
Here’s tonights stream… see you there!
Update 4
Aug 23 2021
I’m done!
This weekend I set about completing all features and it all went pretty smoothly.
After Friday nights stream i’d captured one or two comments which meant I could now work on the Function and UI that displays them on the site. Requesting the comments from Fauna doesn’t require user authentication unlike posting a comment which does and was the more complicated part of this feature.
Rendering the comments was no problem, Theme UI comes with a <Card /> so I styled it up and wallop job done.
Next up was Reactions. This was a two part feature. First I needed create the Function that posts a reaction object to
Fauna, the payload is a reaction name and a date. The date is created on the client so it’s accurate to timezone of
where the user was at the time they posted it, i’m not sure i’ll do anything with the timestamp now but it might have
made for an interesting data viz piece to show reactions over time.
Once I could post reactions I could then set about retrieving them. Same kind of approach as used to get all the
comments but with reactions i needed to use Array.reduce on the server and sum up each reaction by name so I can
display the count in the UI. The Reactions component, self updates and by this I mean once a reaction has been sent
successfully i’m using a useEffect that fires when the post response resolves. The useEffect then calls a get all
reactions function which returns the summed up reactions from Fauna/the server
Strictly speaking this isn’t a Gatsby Function feature but, i’ve added a few more Google Analytics queries to the build
step and i pass them into Gatsby Data layer so I can display stats about which city, country and continent along with
some details about which technology is used by visitors to the site. These are shown in the UI using another Theme UI
<Card /> component and a clear heading.
Lastly I updated the README with documentation about how each function works and linked to all the #GatsbySummerFunctions streams where we’d previously built each of the features in Groovy Analytics site.
I’m now pretty happy with it and in total spent 26 hours designing and developing. I had originally set out to do this in 24 hours but ran a little over.
That’s it, all done!
Stay Funky!